
Azurite Mapping
Turn measurements into clear, report-ready maps.
Create noise, gas, and dust maps using your measurement data and facility drawings—all in your browser.
Already have an account? Log in

Example maps
See what your measurements reveal
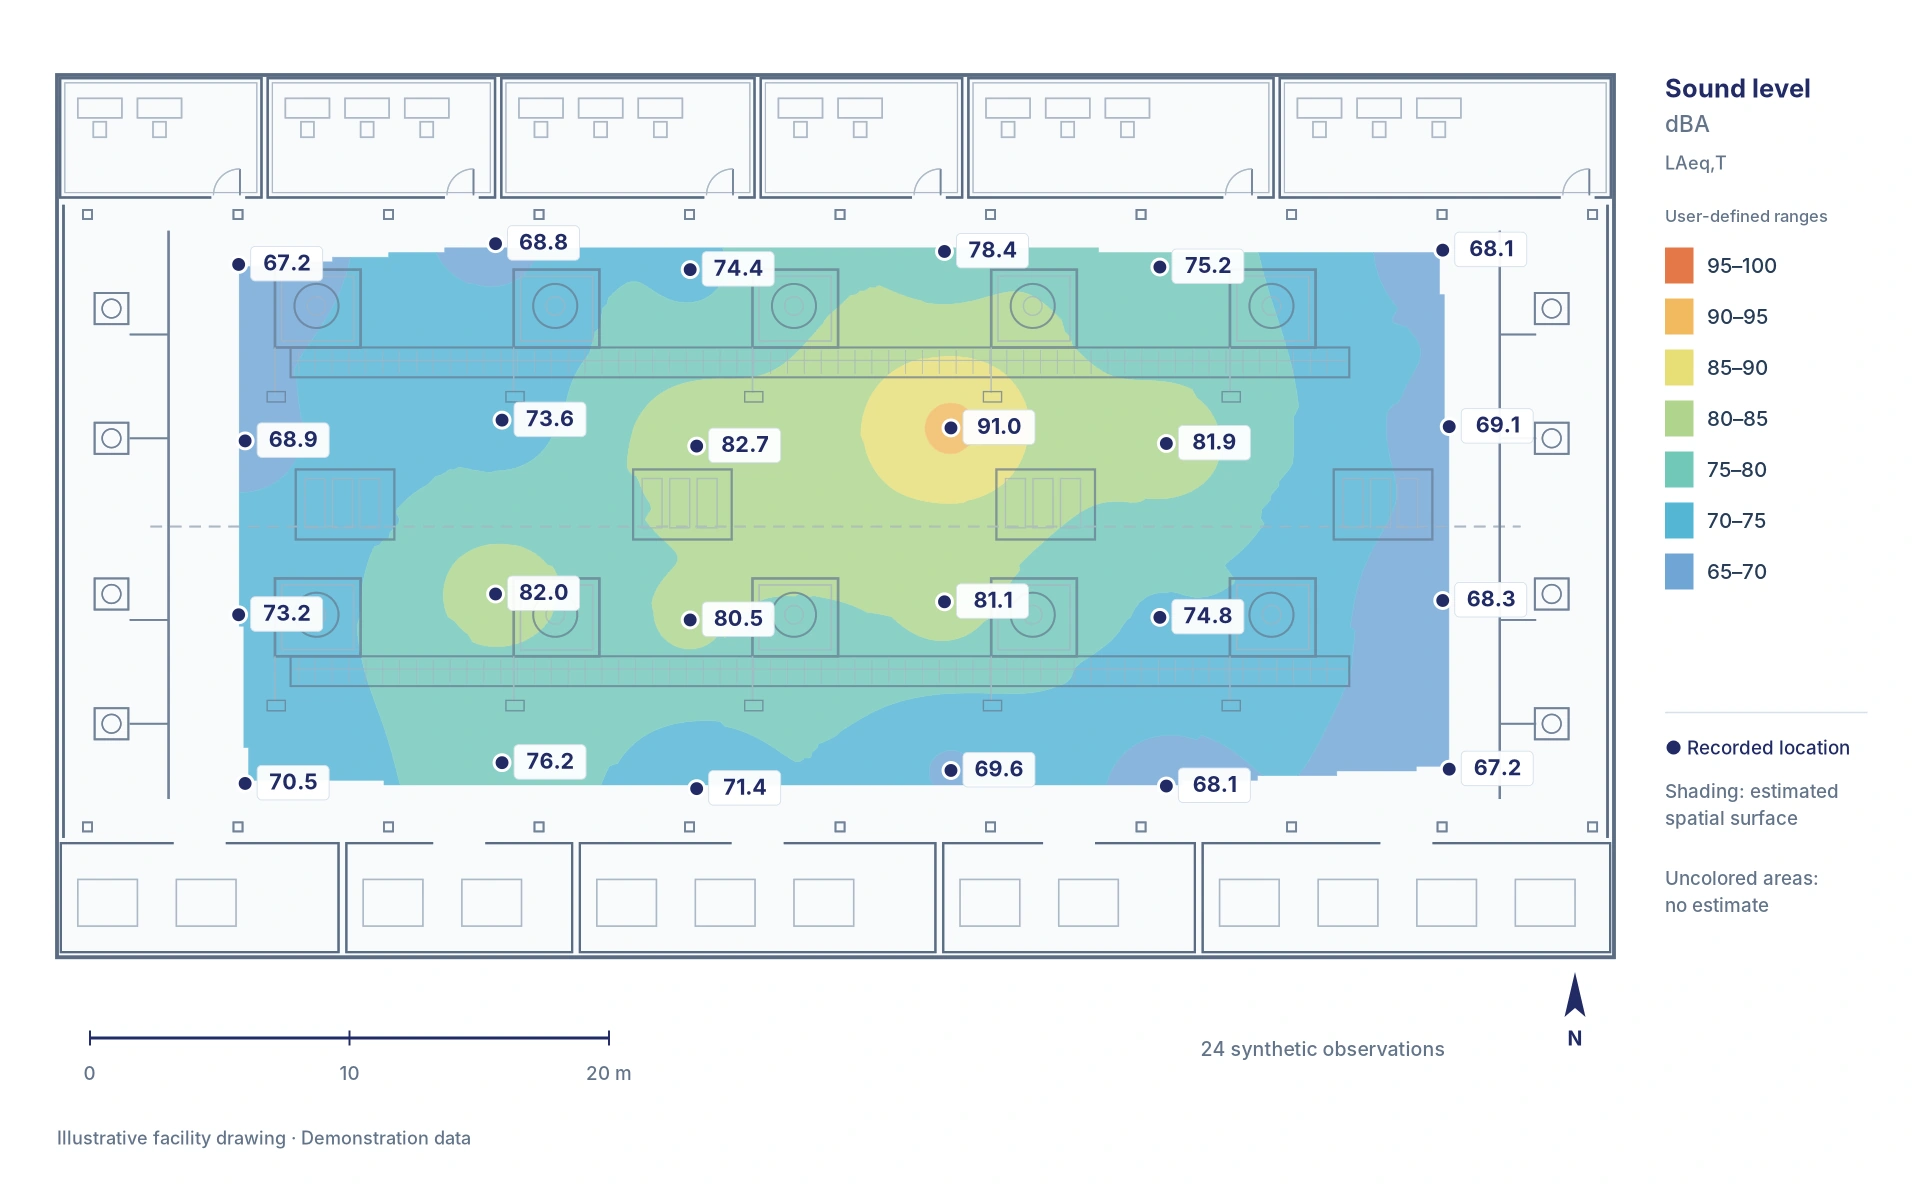
Show how measurements vary across an area, with locations, readings, and mapped patterns presented together.
Present measured A-weighted sound levels alongside an estimated spatial surface. Keep the recorded readings and color ranges visible in one map.
- Measurement
- A-weighted sound level
- Unit
- dBA
Workflow
From facility drawing to finished map
Add your drawing
Start with a PDF, PNG, or JPEG. Set the drawing scale using a known distance in feet or meters.
Add your measurements
Enter readings manually or import the CSV template. Position each reading at its measurement location.
Prepare your output
Choose color ranges, labels, and displayed precision. Save your survey and export the finished map.
Reporting
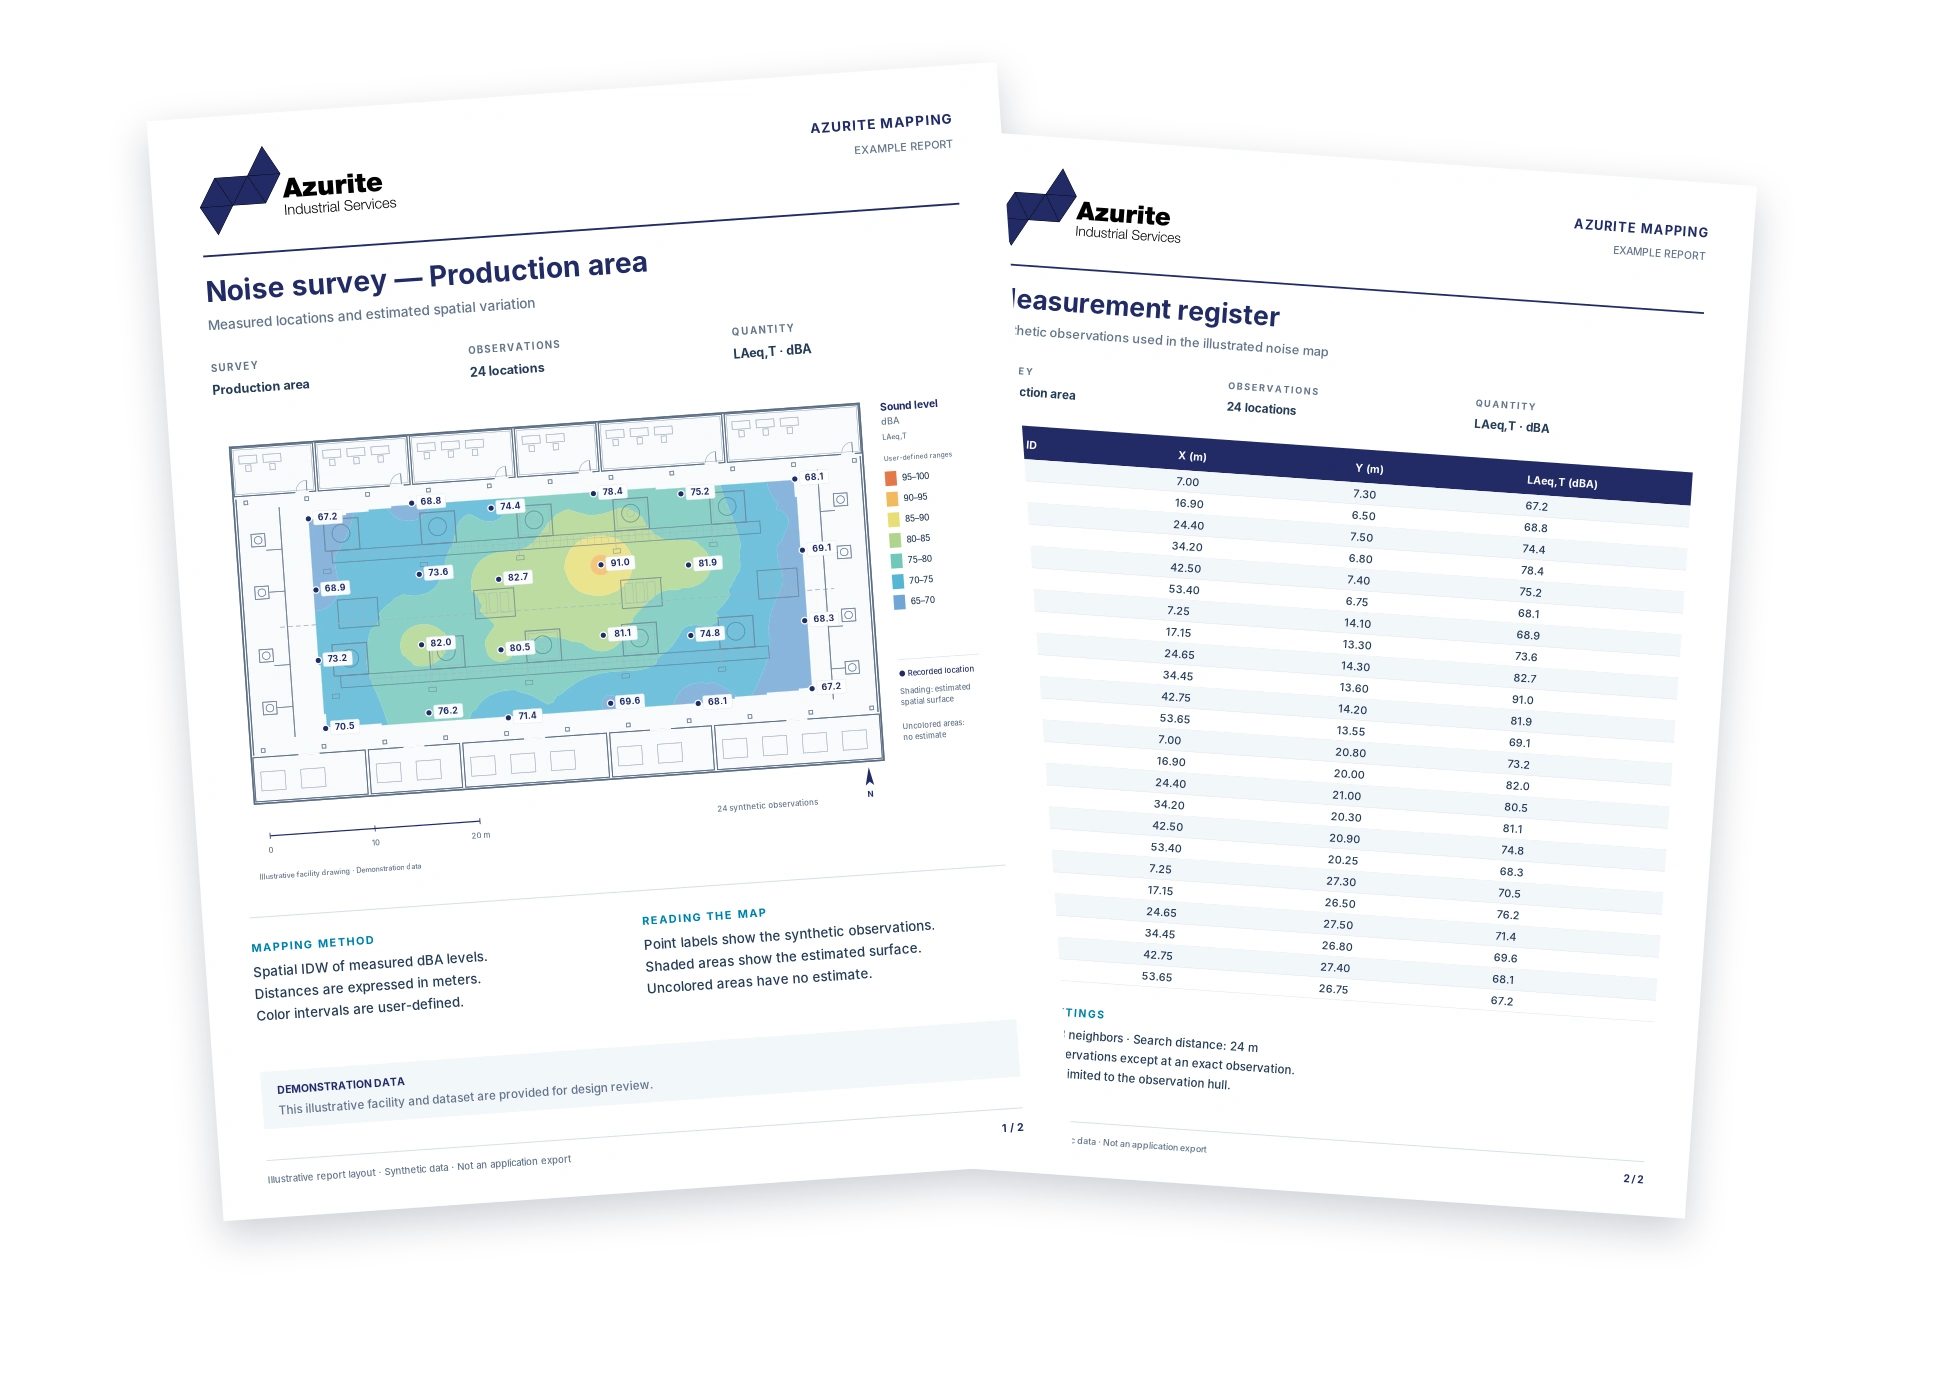
Professional maps for your reports
Bring measurement locations, color bands, labels, and a clear legend into a map your audience can read and review.
Export vector map artwork for use in your reports, presentations, and facility documentation.
View the sample report ↗View an actual CO₂ map export ↗
Native single-page export from a synthetic application survey.
Professional access
Annual licensing
Straightforward access for individual professionals and company teams.
| License | Coverage | Annual fee |
|---|---|---|
| Single-user | One named user | US$249 |
| Company | Unlimited users within one countryEach user receives their own login. | US$799 |
Annual subscriptions. Prices in USD.
For students and educators
Learn with it. Put it to work.
Free educational access for qualified students and instructors. Bring measurement mapping into coursework, practical exercises, and academic projects.